What is Performance Monitoring with Azure DevOps?
Performance Monitoring with Azure DevOps is a critical aspect of the software development and operational process. It involves continuously tracking the performance of applications and systems by collecting, analyzing, and responding to performance data. This process helps teams detect performance degradation and identify bottlenecks that could potentially affect user satisfaction and system reliability. Azure DevOps supports this monitoring by integrating with various tools and services that facilitate real-time insights and proactive optimizations, making it easier for teams to maintain the health and efficiency of their applications.
Why set up a performance testing framework?
Setting up a performance testing framework is essential for organizations focused on the scalability, responsiveness, and stability of their software applications. By standardizing testing procedures across development stages, this framework ensures consistent and repeatable tests, crucial for early identification and mitigation of potential performance bottlenecks.
A structured framework not only fosters collaboration and knowledge sharing among team members but also integrates seamlessly with continuous integration and deployment practices. This boosts productivity and efficiency, systematically enhancing test reliability and building confidence in the application’s performance under both expected and peak loads.
Ultimately, the aim of a performance testing framework is to streamline testing processes, enabling the delivery of high-quality software that meets rigorous performance standards. This proactive approach helps in maintaining software effectiveness over time, ensuring it continues to meet evolving performance expectations.
Building an Integrated Performance Testing Pipeline in Azure DevOps
Performance Testing Pipeline Setup in Azure DevOps
The focus is on the integration of various services to establish a performance testing framework, leveraging resources, such as:
Key Components of the Performance Test Framework Setup:
- Integration of Apache JMeter for creating test scenarios.
- Utilization of Azure Load Testing to simulate diverse user load conditions.
- Implementation of Grafana for real-time monitoring and visualization of performance metrics.
- Coordinate and automate tasks using Azure DevOps.
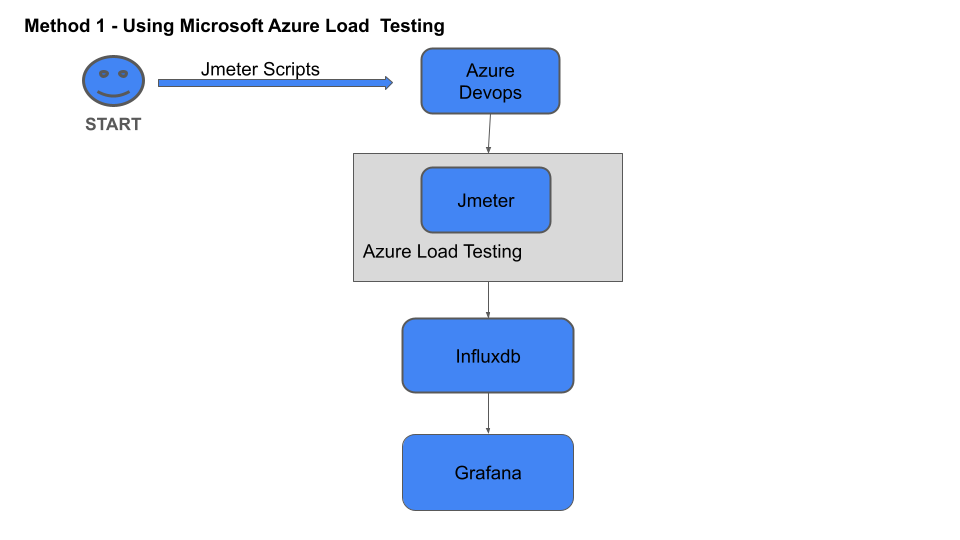
We have created a JMeter script for endpoints that integrates with InfluxDB and Grafana to generate insightful visual graphs. This performance test is set to run on Azure Load Testing, offering a scalable environment. The entire test process can be easily initiated through Azure Pipelines, streamlining the execution and analysis of the application's performance.
Comprehensive Architecture Overview
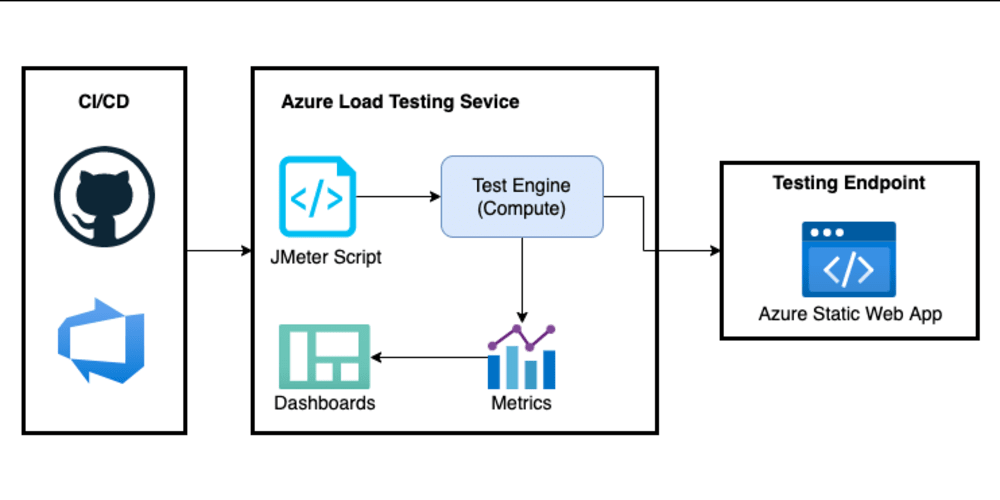
Initiating with the scripting phase in JMeter, our performance testing journey smoothly progresses into Azure DevOps for streamlined pipeline orchestration. Here, the process commences with the creation of performance test scripts, setting the foundation for subsequent stages. Transitioning to Azure Load Testing, these meticulously crafted scripts simulate diverse user load conditions. The generated performance data seamlessly flows into InfluxDB, ensuring efficient storage and accessibility. Concluding the workflow, Grafana transforms this stored data into real-time insights, culminating in a dynamic and comprehensive performance monitoring experience.
Services/Endpoints to be Tested
As part of our testing strategy, we utilize a dummy website, called "JPet Store." This dummy website serves as a sample scenario for our testing purposes. By integrating this dummy website into our framework, we can effectively showcase the capabilities of our testing solution.
- Scenario 1 : BuyPet.
- Scenario 2 : AddToCart.
Example: By taking the example let's try to understand the Jmeter script and its parameters being passed.
Scenario 1: BuyPet: As per the User flow scripting has been done as seen in the below snapshots.
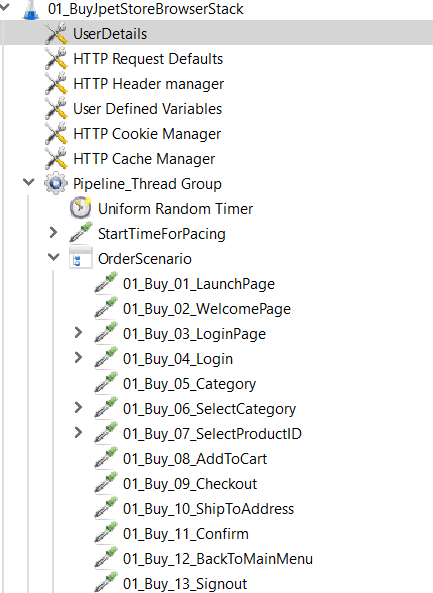
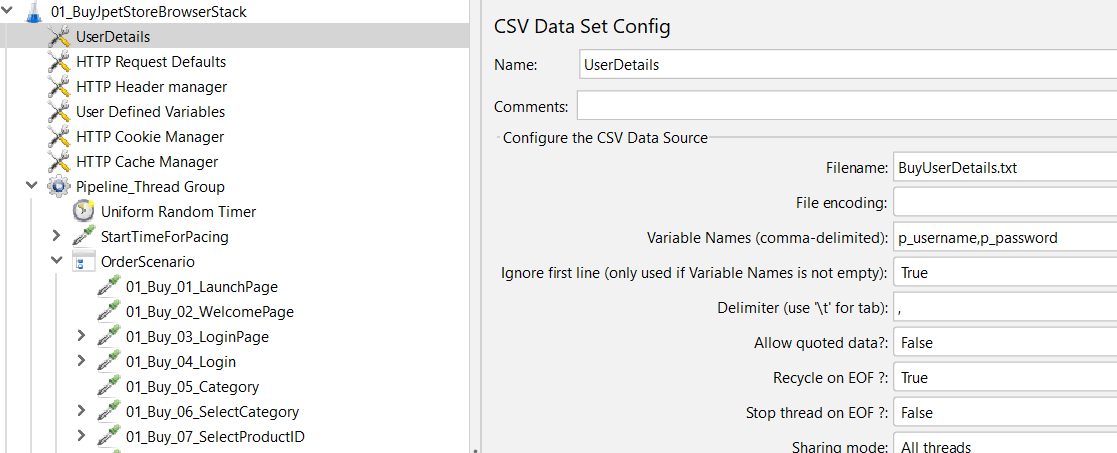
Passing parameters such as URL and login credentials is integral to our approach. At the Test Plan level, essential Config Elements—HTTP Request Defaults, HTTP Header Manager, and User Defined Variables—are strategically placed to house common information for all endpoints. To enhance flexibility and maintainability, we recommend uploading UserDetails in CSV format or as a text file. It is important to ensure accurate configuration of variables within the script for seamless integration and proper functionality.
User-Defined Variables:
This is one of the important steps as this enables us to pass the run time values while triggering the respective pipeline. Pass the parameters that are mentioned under “Name” and pass the corresponding values in the Pipeline yaml file.
Test execution values can be passed to the DevOps pipeline using the following syntax in User-Defined Variables:
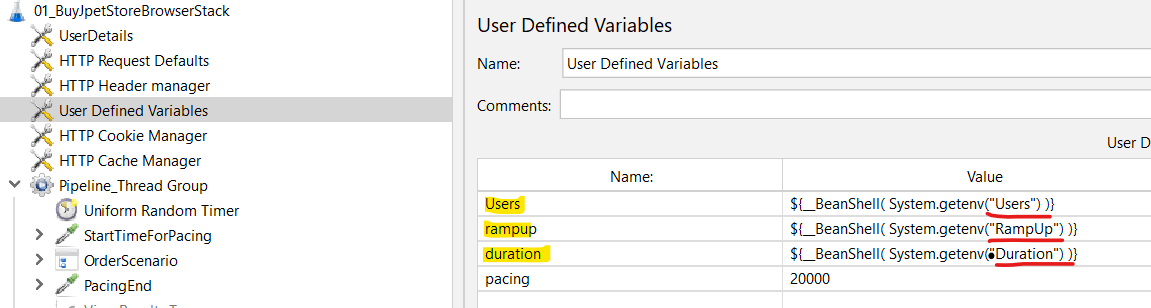
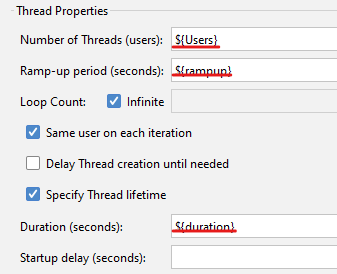
To execute scripts in the local JMeter environment, substitute the following parameters with the corresponding values for Users, Ramp Up, and Duration: ${Users}, ${rampup}, and ${duration}.
- Users:
Set the desired number of virtual users or concurrent users that the performance test should simulate. Replace ${Users} with the specific numerical value representing the user load.
- Ramp Up:
Define the duration over which the specified number of users will be gradually added to the test. Replace ${rampup} with the desired ramp-up time in seconds.
- Duration:
Specify the total duration for which the performance test should run, measuring system behaviour under sustained load. Replace ${duration} with the desired test duration in seconds.
InfluxDb Configuration in Jmeter
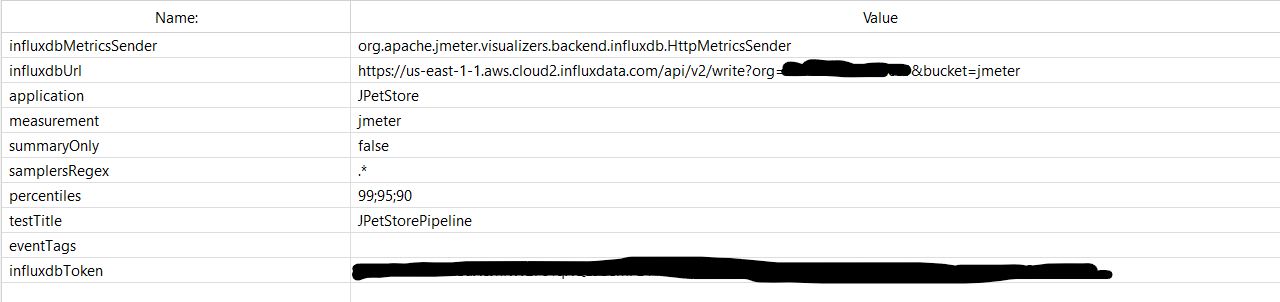
Setting up InfluxDB integration in JMeter is a straightforward process. Begin by adding the 'Backend Listener' to your test plan and specify the listener class as 'org.apache.jmeter.visualizers.backend.influxdb.InfluxdbBackendListenerClient'. Input the InfluxDB server details, including URL, database name, and authentication credentials. Confirm compatibility with the InfluxDB version and configure reporting parameters such as granularity and percentiles.
Make sure to accurately pass the configured InfluxDB details to the Backend Listener in the JMeter script. The Backend Listener, when integrated with these InfluxDB specifics, will seamlessly transmit performance data to Grafana for visualization.
Key parameters for the Backend Listener configuration include InfluxDB URL, Bucket Name, Organization Name, and Token. Ensure correct values for these parameters to facilitate proper functioning. Execute test, and InfluxDB will efficiently store and manage performance data for insightful analysis, enabling visual representation through tools like Grafana.
In our setup, we're utilizing the InfluxDB Cloud URL.
Grafana Configurations
In Grafana, obtaining details from InfluxDB involves a simple yet effective process. Begin by adding InfluxDB as a data source in Grafana and specify the InfluxDB server details, including the URL, database name, and authentication credentials. In the panel settings, configure queries by selecting the data source and defining the metric or measurement you want to visualize. You can use the query editor to refine your queries and customize visualizations. Once configured, you can create a dashboard by selecting the desired metrics and visualizations. Link the data source to your dashboard, and Grafana will seamlessly fetch performance data from InfluxDB, enabling the creation of insightful and dynamic visual representations of your metrics.
When triggering a performance test, head to Grafana, where a specialized Performance Testing Dashboard awaits. Upon initiating the test, real-time graphs and visualizations can be observed on the Grafana Dashboard, providing instant insights into the application's performance metrics.
We've crafted a dashboard encompassing vital metrics, and the Dashboard JSON can be obtained from an online source or can be customized to meet specific requirements.
Azure DevOps
Incorporating Azure DevOps into the performance monitoring framework involves several key steps:
- Project Configuration: Create a new project or navigate to an existing one in Azure DevOps tailored to your performance monitoring goals.
- Pipeline Creation: Develop an automated testing pipeline within Azure DevOps, setting up triggers for predefined intervals or on-demand testing.
- Version Control Integration: Integrate performance test scripts with Azure DevOps version control to ensure efficient versioning and collaborative script development.
- Artifact Management: Use Azure DevOps for artifact management, centralizing storage for vital files, including performance scripts, configurations, and dependencies.
- Task Automation: Employ Azure DevOps tasks to automate key aspects of the performance monitoring setup, covering data collection, result aggregation, and reporting.
By following these steps, we establish a streamlined and automated performance monitoring environment with Azure DevOps at its core.
Understanding YAML Configuration for Pipeline Choices
Let's begin by exploring how to create a pipeline. We'll use screenshots to guide us through each step and break down the code snippets to understand their purpose in simple terms.
- Before initiating the pipeline creation process, let's establish a repository under the Project folder. If the 'project' folder is not already in place, we'll create it.
To create a YAML configuration for an Azure DevOps pipeline, follow these high-level steps:
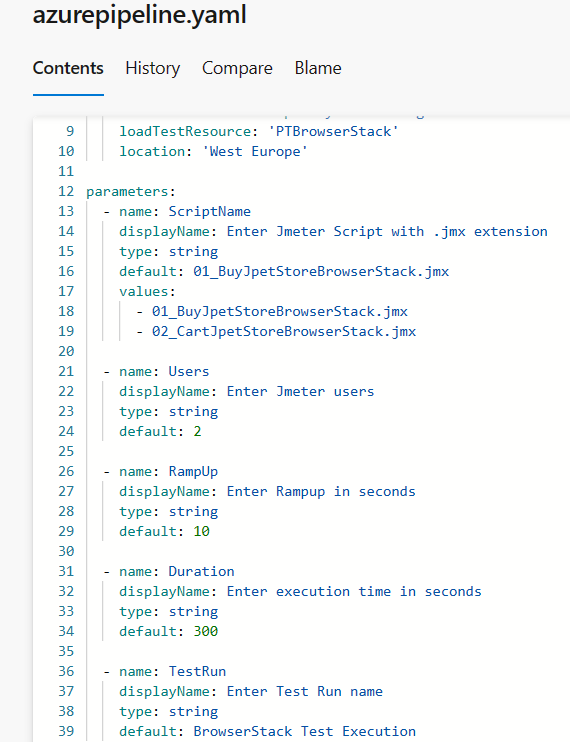
- Initialization: Begin by defining the initial configuration parameters (Scriptnames, Users, RampUp, etc).
- Pool Section: The pool section in an Azure DevOps YAML pipeline specifies the agent pool where the jobs in your pipeline will run.
- Variables Section: The variables section allows you to define variables that can be used throughout your pipeline. Variables provide a way to store and reuse values, making your pipeline more dynamic and customizable (ServiceConnection, loadtestResource, SubscriptionId).
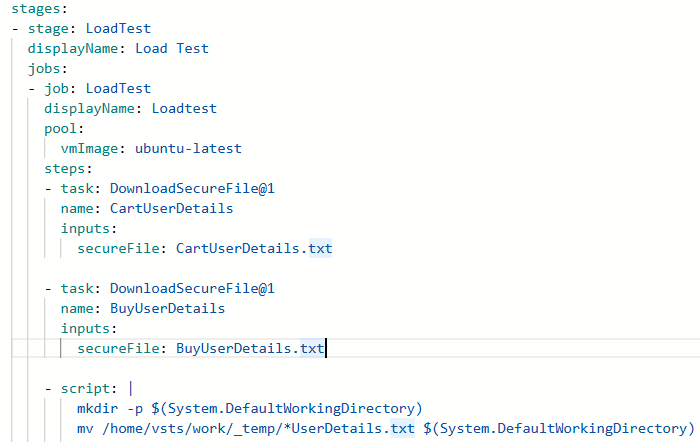
- Define Stages: Organise the pipeline into distinct stages, each representing a phase in your continuous integration or deployment process. Stages are defined under the stages keyword in your YAML configuration. Each stage represents a logical unit in your CI/CD process, such as Build, Test, Deploy, etc. Stages allow you to organize and structure the execution of your pipeline.
- Tasks within Stages: Tasks are the individual steps or actions that need to be performed within a job. Tasks can include actions like running scripts, using specific tools, or interacting with external services.
- Artifact Publishing: At the end of a stage or the entire pipeline, publish artifacts to store and share files generated during the build or deployment process.
- Review and Adjust: Regularly review and adjust the YAML configuration based on your project's evolving needs.
- Now, let's delve into an overview to understand the structure of the pipeline.
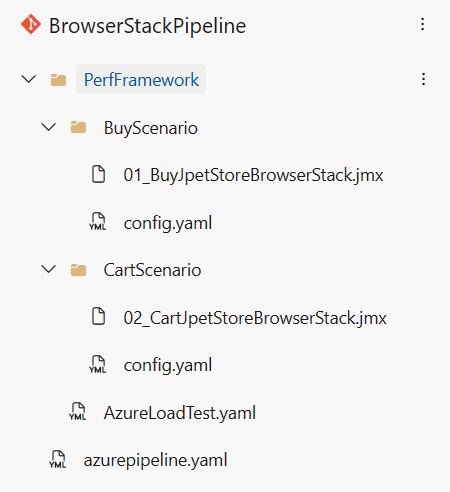
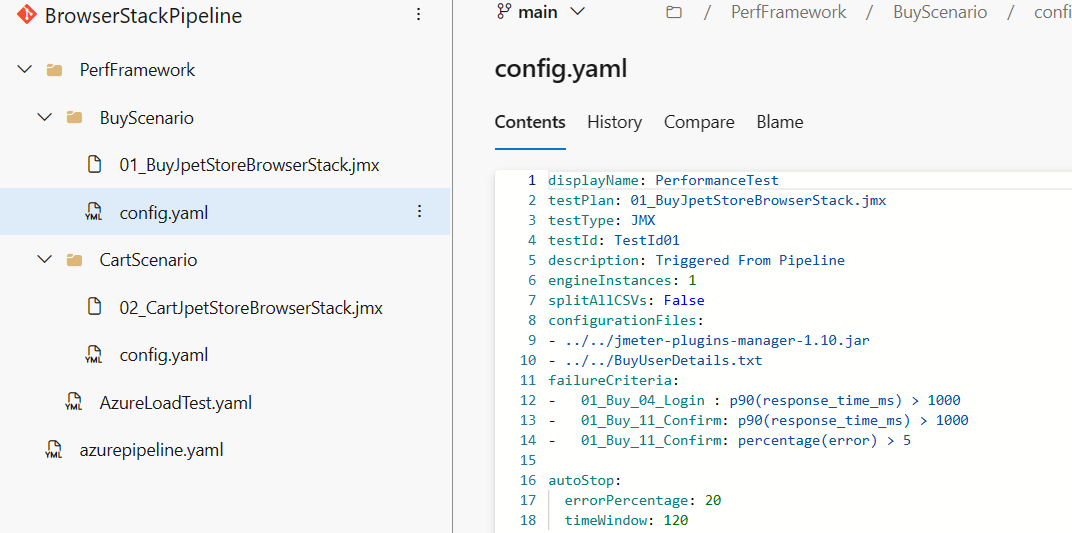
In our project, we've organized folders based on two distinct scenarios or user flows. Within each scenario folder, there is a dedicated config.yaml file and a JMeter script (jmx). At the project level, there's a main YAML file named azure-pipeline.yaml containing the overarching pipeline configuration.
Additionally, we have a file named for URL details and another YAML file (azureloadtest.yaml) housing a common code snippet applicable to two scripts. This structure helps maintain a clear and organized layout for the pipeline.
- Let's look into the configuration for the 'BuyJpet' scenario, focusing on the config.yaml and azure-pipeline.yaml files. We securely store login files in the Pipeline Library's secure files, ensuring sensitive login information is protected during the pipeline execution. In the main YAML file (azure-pipeline.yaml), we can see the code snippet has placed a secure file download ( secure files are placed under pipeline-> library, particularly the User details, crucial for the execution).
- The plugin manager, necessary component for all scripts, hence the code snippet is written to be directly downloaded from the web.
- To facilitate dynamic script selection during runtime, an 'if' condition is implemented, allowing us to choose from two scripts. In case no specific script is chosen, default options are automatically selected. Following the test execution, artifacts are generated for further analysis.
- In the config.yaml file, we pass essential details such as the test plan, test ID, configuration specifics, and failure criteria for the test running in Azure Load Testing.
- We've introduced a template named AzureLoadTest.yaml, seamlessly incorporating the Azure Load Test task. This task is pivotal, leveraging the Azure Load Testing service, a critical component for executing our performance tests. To utilize the Azure Load Testing service in the Azure portal, the initial step involves creating a resource group with a specified location and configuring the Load Test resource. These essential details should be entered into the YAML file under the 'variables' section along with details of subscriptions and service connection.
config.yaml - Here criteria have been initially set for specific endpoints/transactions, providing flexibility to customize as per project requirements.
When triggering the pipeline, you have the option to choose and customise runtime values, along with testrun name making the testing process more adaptable and realistic. If no values are explicitly passed, the pipeline will default to predetermined settings.
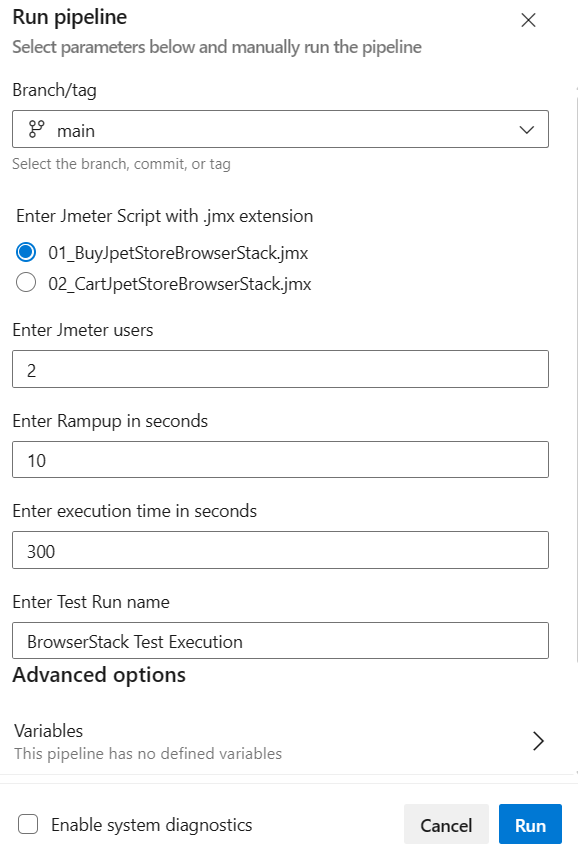
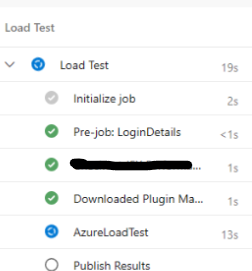
Once the pipeline is initiated, click on the "Load Test Job". If you have enabled system diagnostics, you can access a more detailed view.
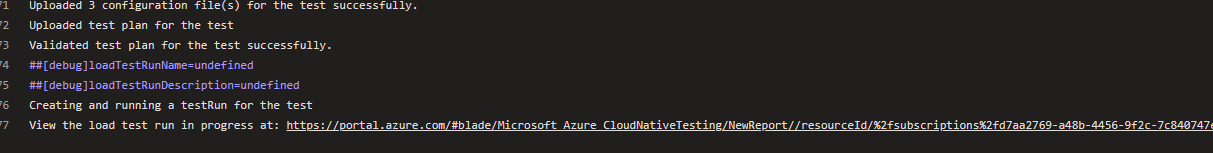
Here, you can find the link for the "Azure Portal" under the Azure Load Tests section. You can inspect the test execution.
Additionally, explore the Grafana dashboard to visualize client-side metrics graphs.
After the execution is completed, the results will be published according to the criteria specified in the config.yaml file. These criteria can be adjusted based on team requirements.
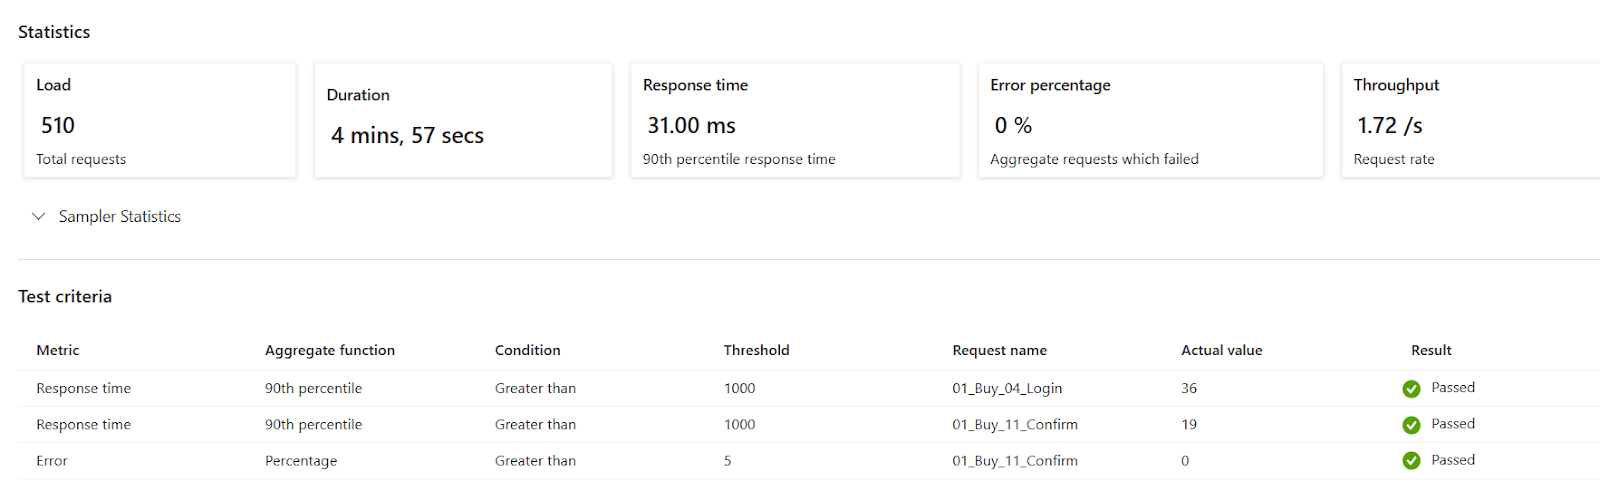
Explore Azure Load Testing Details in Azure Portal
Additional test details can be accessed and reviewed within Azure Load Testing.
To compare up to five test runs simultaneously, use the below Azure Load Testing feature:

Grafana
Grafana Dashboard
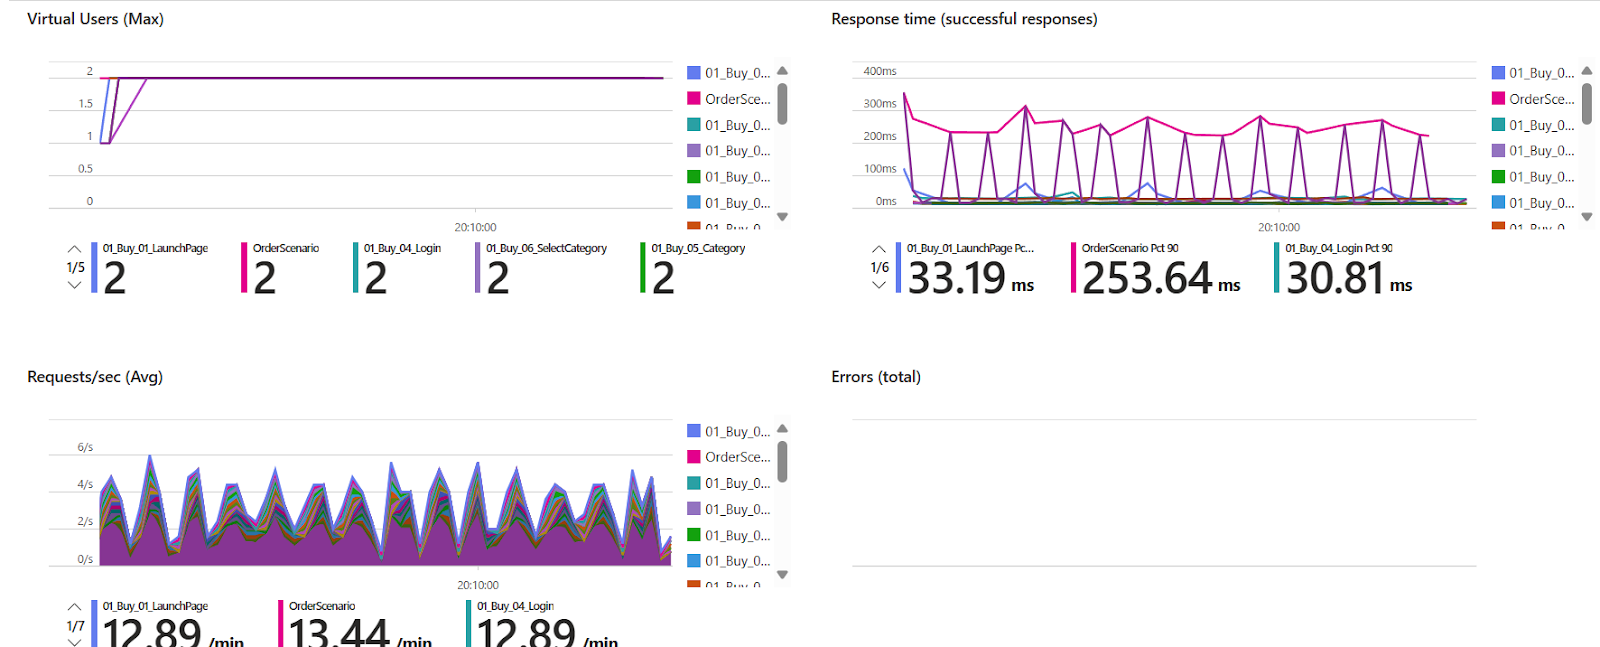
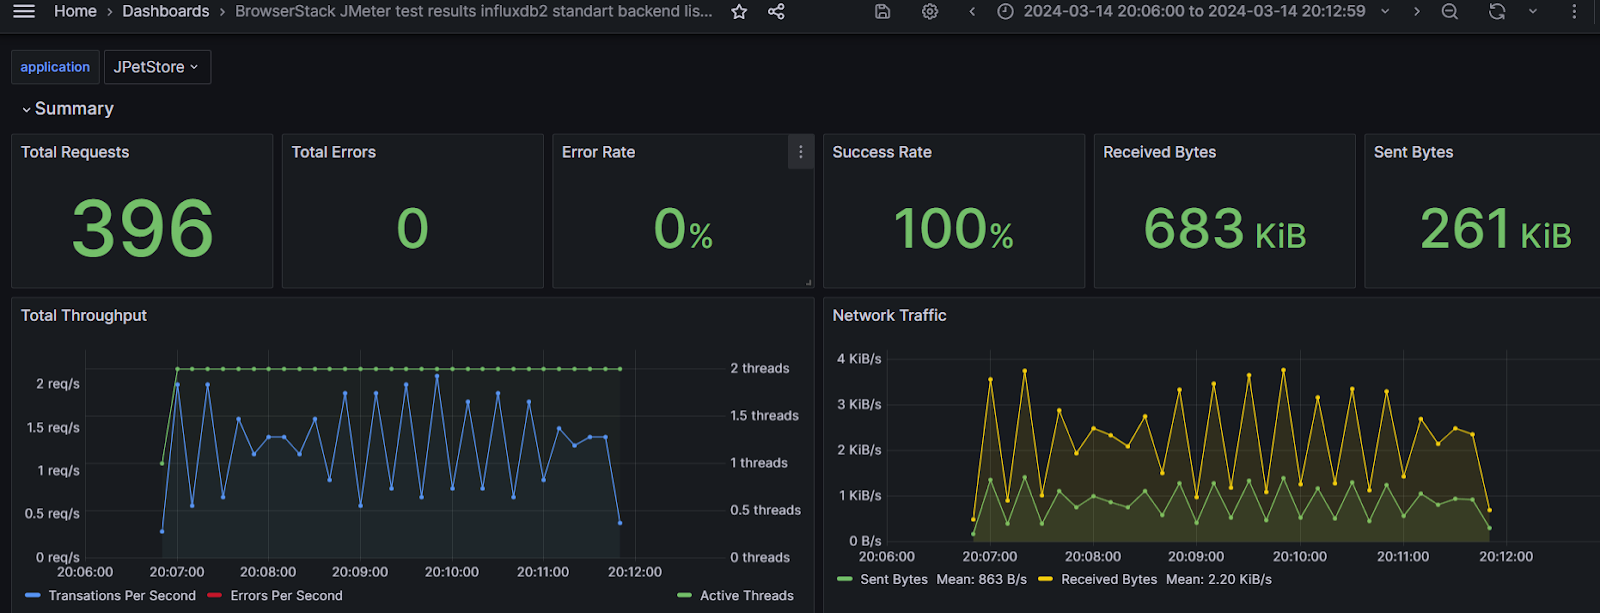
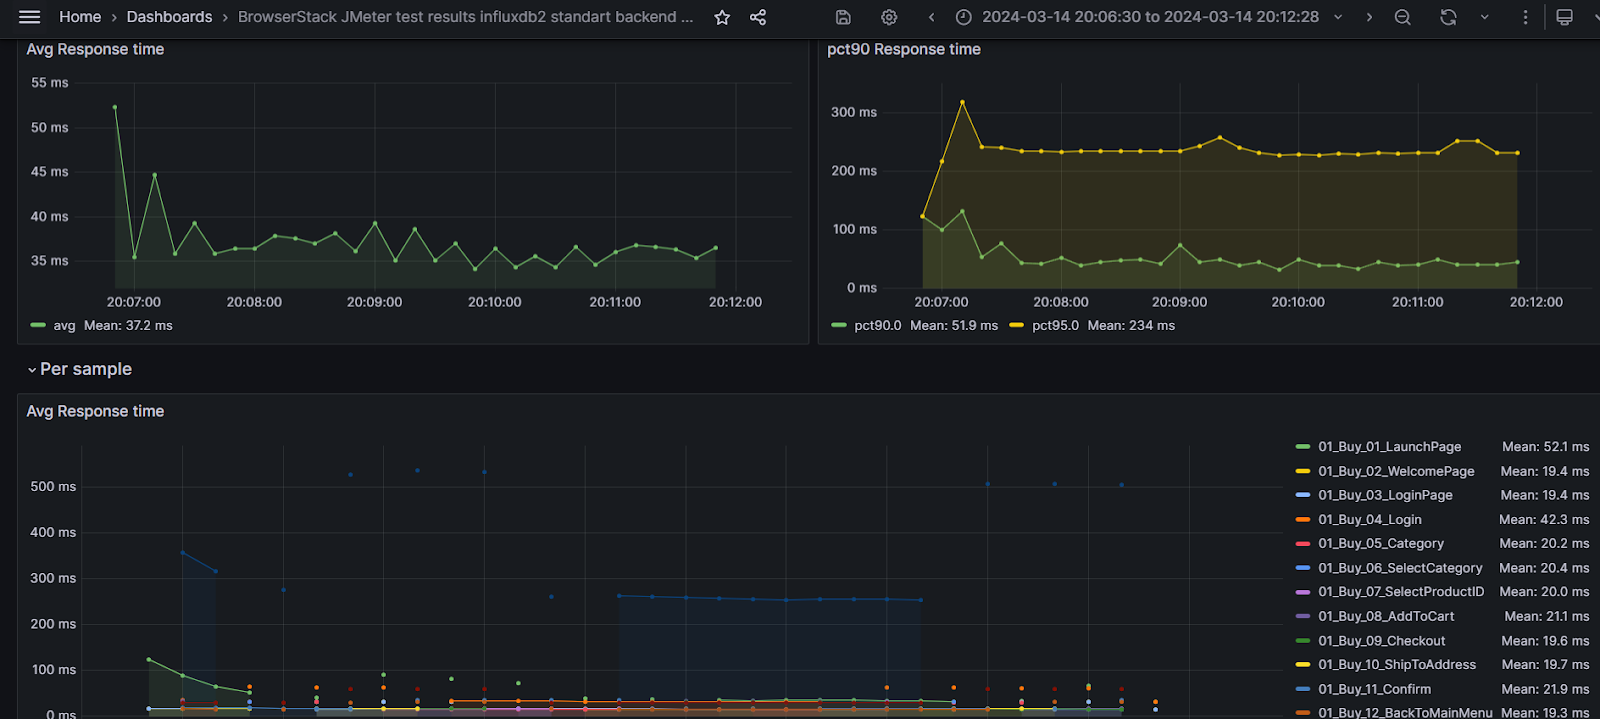
The Grafana dashboard acts as a central hub where the results of performance tests are presented in a user-friendly format, making it easy to interpret and analyze the data.
The integration between Grafana, InfluxDB, and JMeter works seamlessly to provide insightful performance metrics. JMeter executes tests and sends the collected metrics to InfluxDB, acting as a repository for the data. Grafana then retrieves this data from InfluxDB and translates it into dynamic graphs and visualizations.
With Grafana, you can apply specific execution time and view graphs for the desired metrics, allowing for a detailed analysis of performance test outcomes.
To visualize these metrics effectively, see the snapshots below, showcasing some of the key performance indicators:
Final thoughts
In conclusion, the implementation of the performance monitoring framework has significantly optimized testing processes, facilitating efficient identification and proactive resolution of performance issues. Incorporating shift-left testing methodologies addresses performance concerns earlier in the development lifecycle, minimizing the risk of issues reaching production environments.
As we move forward, the framework can be further enhanced by implementing alerts based on key performance indicators, ensuring prompt identification and resolution of anomalies. Additionally, it opens the door for scheduling tests, enabling automated execution of load tests through the pipeline. These advancements will strengthen our ability to maintain high-performance standards and proactively address any potential challenges that may arise.
Overall, the framework enables the delivery of high-quality software that meets stringent performance requirements and provides a foundation for ongoing optimization and refinement in response to evolving demands and user expectations.